DATA SOURCES
Riverside County Overdose Data to Action
The GIS driven dashboard displays data on fatal overdoses, opioid related emergency department visits, and opioid related calls to poison control. Maps are based on census tracts and interactive to allow the user to view more detail when a census tract is selected. Demographic data such as gender, age, and race/ethnicity (when available), are also displayed on the dashboard. Users can download de-identified data, when available.
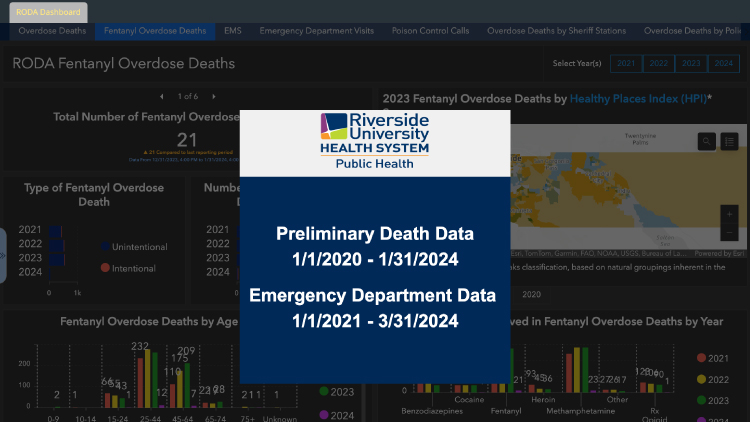
RUHS—Public Health disseminates monthly overdose reports that includes data from Emergency Departments (Syndromic Surveillance) and mortality data (California Electronic Death Registration System). An additional report from Riverside County’s Emergency Medical Services Agency includes data on suspected opioid overdoses using FirstWatch data. This report provides an in-depth overview of suspected overdoses, Narcan administration and type of drugs mentioned in overdose calls. Reports can be accessed on the Riverside County Overdose Data to Action website. For more information or to be added to the surveillance report distribution list, email RODA@ruhealth.org.
This dashboard provides data on state and local level drug related overdose outcomes for California. Data includes deaths, emergency department visits, and hospitalizations, as well as opioid and select other drug prescription data. Data can be viewed at the county level.
CALIFORNIA SCHOOL CLIMATE, HEALTH AND LEARNING SURVEY
The District CalSCHLS data dashboard includes data from domains of school engagement and supports, school disciplinary environment, substance use, routines, mental health and school safety and cyberbullying. Data can be viewed at the state, county, or district level. The portal also includes data from California Healthy Kids Survey, California School Staff Survey, and California School Partner Survey.

DataQuest is the California Department of Education’s webbased data reporting system for publicly reporting information about California students, teachers, and schools. DataQuest provides access to a wide variety of reports, including school performance, test results, student enrollment, English learner, graduation and dropout, school staffing, course enrollment, and student misconduct data.
DATA USE GUIDELINES
- Tell a story with the data. When possible, it’s important to use qualitative (e.g., questionnaires, interviews, observation) and quantitative data (e.g., numerical values, such as death counts, emergency department visit counts).
- When including qualitative data, it’s important to include people with lived experience/the intended community. This can help inform efforts to address needs of target population (Center for Health Care Strategies, 2021).
- Be mindful of how data is presented and simplify ways of portraying data. It’s important to present data that meets the needs of the intended audience. For example, this could include converting data to percentages instead of rates.
- Provide as much context and terminology as possible to avoid misinterpretation of data or highlight any gaps of the data.
- Avoid using data as a scare tactic. Research suggests that scare tactics and fear based messaging does not work for youth. Youth are more receptive to factual based, nonjudgmental content where they’re given the opportunity to learn and maketheir own decisions.
- Language matters. Using person-first language and avoiding terms that create stigma and bias are essential when talking about substance use and addition (NIH, 2021).
